


Look at this graph and be afraid. It does not come from Earth First. It does not come from the Sierra Club. It was not drawn by Socialists or Nazis or Osama Bin Laden or anyone from Goldman-Sachs. If you are a Republican Tea-Partier, rest assured it does not come from a progressive Democrat. And vice versa. It was drawn by the United States Department of Energy, and the United States military's Joint Forces Command concurs with the overall picture.
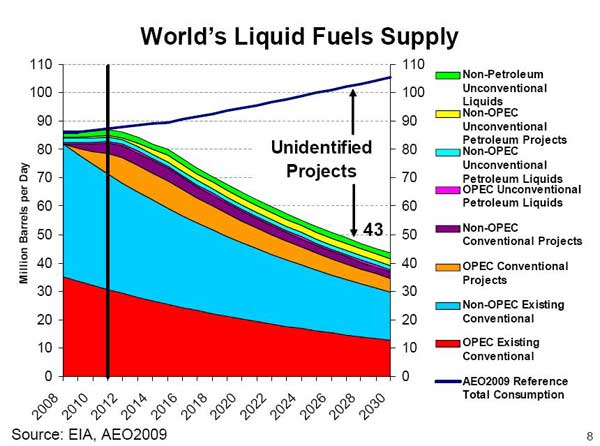
What does it imply? The supply of the world's most essential energy source is going off a cliff. Not in the distant future,but in a year and a half. Production of all liquid fuels, including oil, will drop within 20 years to half what it is today. And the difference needs to be made up with "unidentified projects," which one of the world's leading petroleum geologists says is just a "euphemism for rank shortage," and the world's foremost oil industry banker says is "faith based."
This graph was prepared for a DOE meeting in spring, 2009. Take a good look at what it says. Assuming it to be correct:
- Conventional oil will be almost all gone in 20 years, and there is nothing known to replace it.
- Production of petroleum from existing conventional sources has been dropping at a rate slightly over 4% per year for at least a year and will continue to do so for the indefinite future.
- The graph implies that we are past the peak of production and that there are 750 billion barrels of conventional oil left (the areas under the "conventionals" portion of the graph, extrapolated to the right as an exponentional). Assuming that the remaining reserves were 900 billion or more at the halfway point, then we are at least 150 billion barrels, or 5 years, past the midpoint.
- Total petroleum production from all presently known sources, conventional and unconventional, will remain "flat" at approximately 83 mbpd for the next two years and then will proceed to drop for the foreseeable future, at first slowly but by 4% per year after 2015.
- Demand will begin to outstrip supply in 2012, and will already be 10 million barrels per day above supply in only five years. The United States Joint Forces Command concurs with these specific findings (see http://www.jfcom.mil/newslink/storyarchive/2010/JOE_2010_o.pdf, at 31). 10 million bpd is equivalent to half the United States' entire consumption. To make up the difference, the world would have to find another Saudi Arabia and get it into full production in five years, an impossibility. See The Oil Drum.
- The production from presently existing conventional sources will plummet from its present 81 mbpd to 30 mbpd by 2030, a 63% drop in a 20-year period.
- Meeting demand requires discovering, developing, and bringing to full production 60mbpd (105-45) of "unidentified projects" in the 18-year period of 2012-2030 and approximately 25 mbpd of such projects by 2020, on the basis of a very conservative estimate of only 1% annual growth in demand. The independent Oxford Institute of Energy Studies has estimated a possibe development of 6.5mbpd of such projects, including the Canadian tar sands, implying a deficit of 18-19 mbpd as compared to demand, and an approximate 14 mbpd drop in total liquid fuels production relative to 2012, a 16% drop in 8 years.
- The curve is virtually identical to one produced by geologists Colin Campbell and Jean Laherrere and published in "The End of Cheap Oil," in Scientific American, March, 1998, twelve years ago. They projected that production of petroleum from conventional sources would drop from 74 mbpd in 2003 (as compared to 84 mbpd in 2008 in the DOE graph) and drop to 39 mbpd by 2030 (as compared to 39 mbpd by 2030 in the DOE graph!) See http://www.jala.com/energy1.php.Campbell and Laherrere predicted a 2003 "peak," and the above graph implies a"peak" (not necessarily the actual peak, but the midpoint of production of 2005 or before).
So here we are, if the graph is right, on the edge of a precipice, with no prior warning from either the industry, which knows what it possesses, or the collective governments, which ostensibly protect the public interest. As Colin Campbell, a research geologist who has worked for many large oil companies and studied oil depletion extensively (http://www.peakoil.net/about-aspo/dr-colin-campbell) says, "The warning signals have been flying for a long time. They have been plain to see, but the world turned a blind eye, and failed to read the message." (See also http://www.greatchange.org/ov-campbell,outlook.html.) The world was completely transformed by oil for the duration of the twentieth century, but if the graph is right, within 20 years it will be virtually gone but our dependence upon it will not. Instead, we have
- zero time to plan how to replace cars in our lives
- zero time to plan how to manufacture and install millions of furnaces to replace home oil furnaces, and zero time to produce the infrastructure necessary to carry out that task
- zero time to retool suburbia so it can function without gasoline
- zero time to plan for replacement of the largest military establishment in history, almost completely dependent upon oil
- zero time to plan to support nine billion peolple without the "green revolution," a creation of the age of oil
- zero time to plan to replace oil as an essential fuel in electricity production
- zero time to plan for preserving millions of miles of roads without asphalt.
- zero time to plan for the replacement of oil in its essential role in EVERY industry.
- zero time to plan for replacement of oil in its exclusive role of transporting people, agricultural produce, manufactured goods. In a world without oil that appears only twenty years away, there will be no oil-burning ships transporting US grain to other countries, there will be no oil-burning airlines linking the world's major cities, there will be no oil-burning ships transporting Chinese manufactured goods to the billions now dependent on them.
- zero time to plan for the survival of the billions of new people expected by 2050 in the aftermath of ":peak everything."
- zero capital, because of failing banks ansd public and private debt, to address these issues.
Why zero time?
Because if we at any time use more oil than allowed by the graph, we will have even less later.
Because we are already committed to supporting 2.5 billion more people on what we have.
Because every day we continue upward in our oil consumption, even though we continue to have more people who need it and billions who deserve to rise from abject poverty, we are making the future supply shortage worse.
If you believe the graph, demand will outstrip supply starting at the end of 2011, and severely outstrip supply in five years. What are we going to do, and how are we going to do it? We have no time to decide.
